
Data Visualization for Floral Forms
Blog Post by Cara Pirrello
My sister was getting married. She wanted to save money by doing the flowers ourselves. Over 300 people would be attending. “Did we really want to take this on?” Absolutely. I had a plan.

Big data for the big day.
Sure, we weren’t making sense of trillions of rows of data but my sister need a way to share her vision and analyze decisions. This was a big undertaking in its own right. We would need over 30 arrangements for the tables alone. Initial estimates totaled over 500 stems for 47 the unique deliverables we had outlined.
Things like flower care, arrangement and transportation would be the easy part. I had worked in a flower shop in high school and was familiar with the best practices, but how would we plan and share ideas without an increasing headache? Members of our family offered to help assemble but none had experience. We could count on at least 7 untrained volunteers for 2.5 hrs the day before the wedding.
We needed tools that could remove the noise and highlight useful information.

What was developed and how was it used
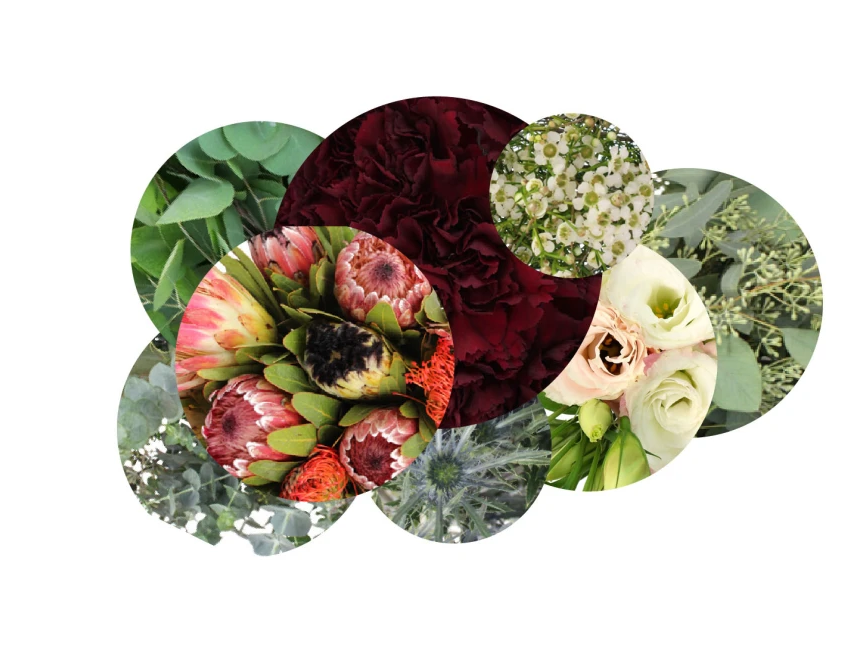
Design Aids
What was the best way to establish proportion and scale while at the same time helping others to understand our plan? My sister knew which flowers she liked and which colors she felt should be dominate. Inspired by the functionality of a word cloud diagram, I developed a system that facilitated easy conversation and helped us to define each type of arrangement.
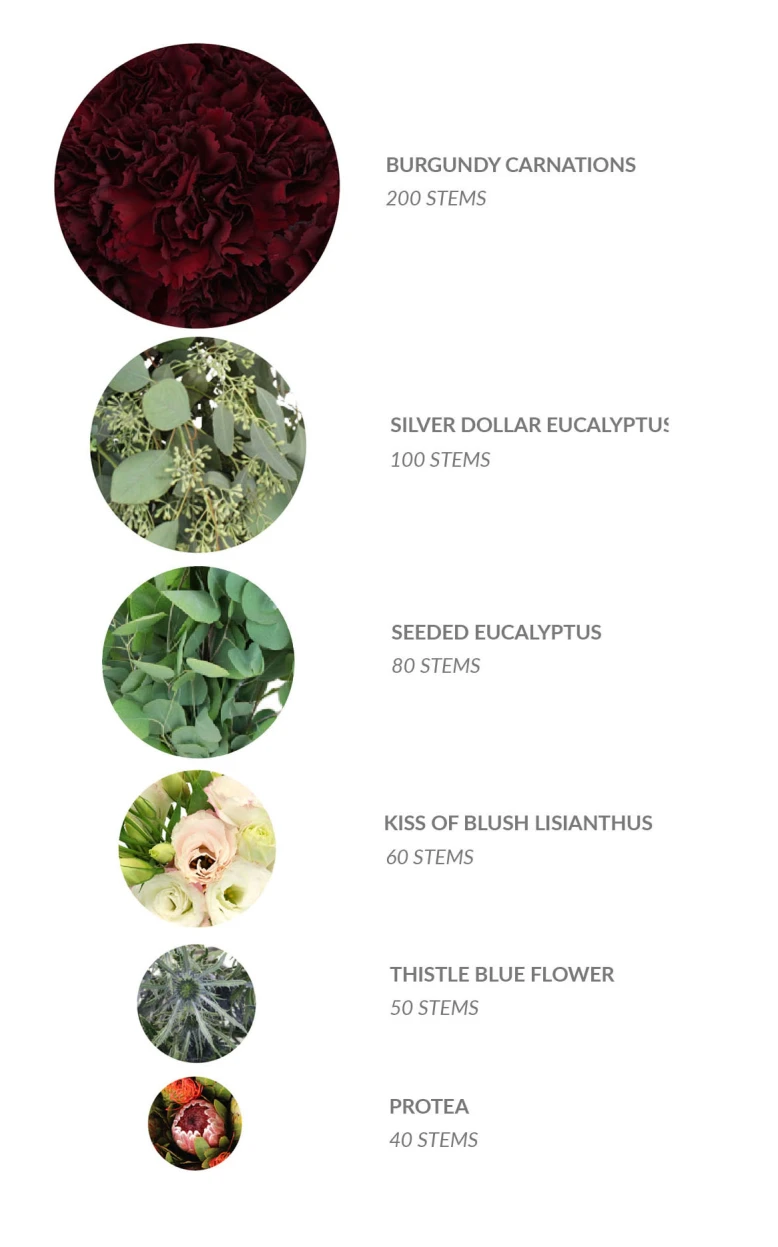
Purchase Tool
Informed by our design aids, the flower total graphic helped us confirm and order inventory, and was referenced when preparing for pre-assembly care.
Assembly Guides
Aunts, cousins, mothers, friends - all were welcome to join us on the day of assembly. We popped champagne and passed out prints. The diagrams that had aided our design and purchasing process were modified to outline flower type and quantity within each arrangement. The work was made simple and enjoyable. Love and laughter was in the air! We finished on time and on budget.

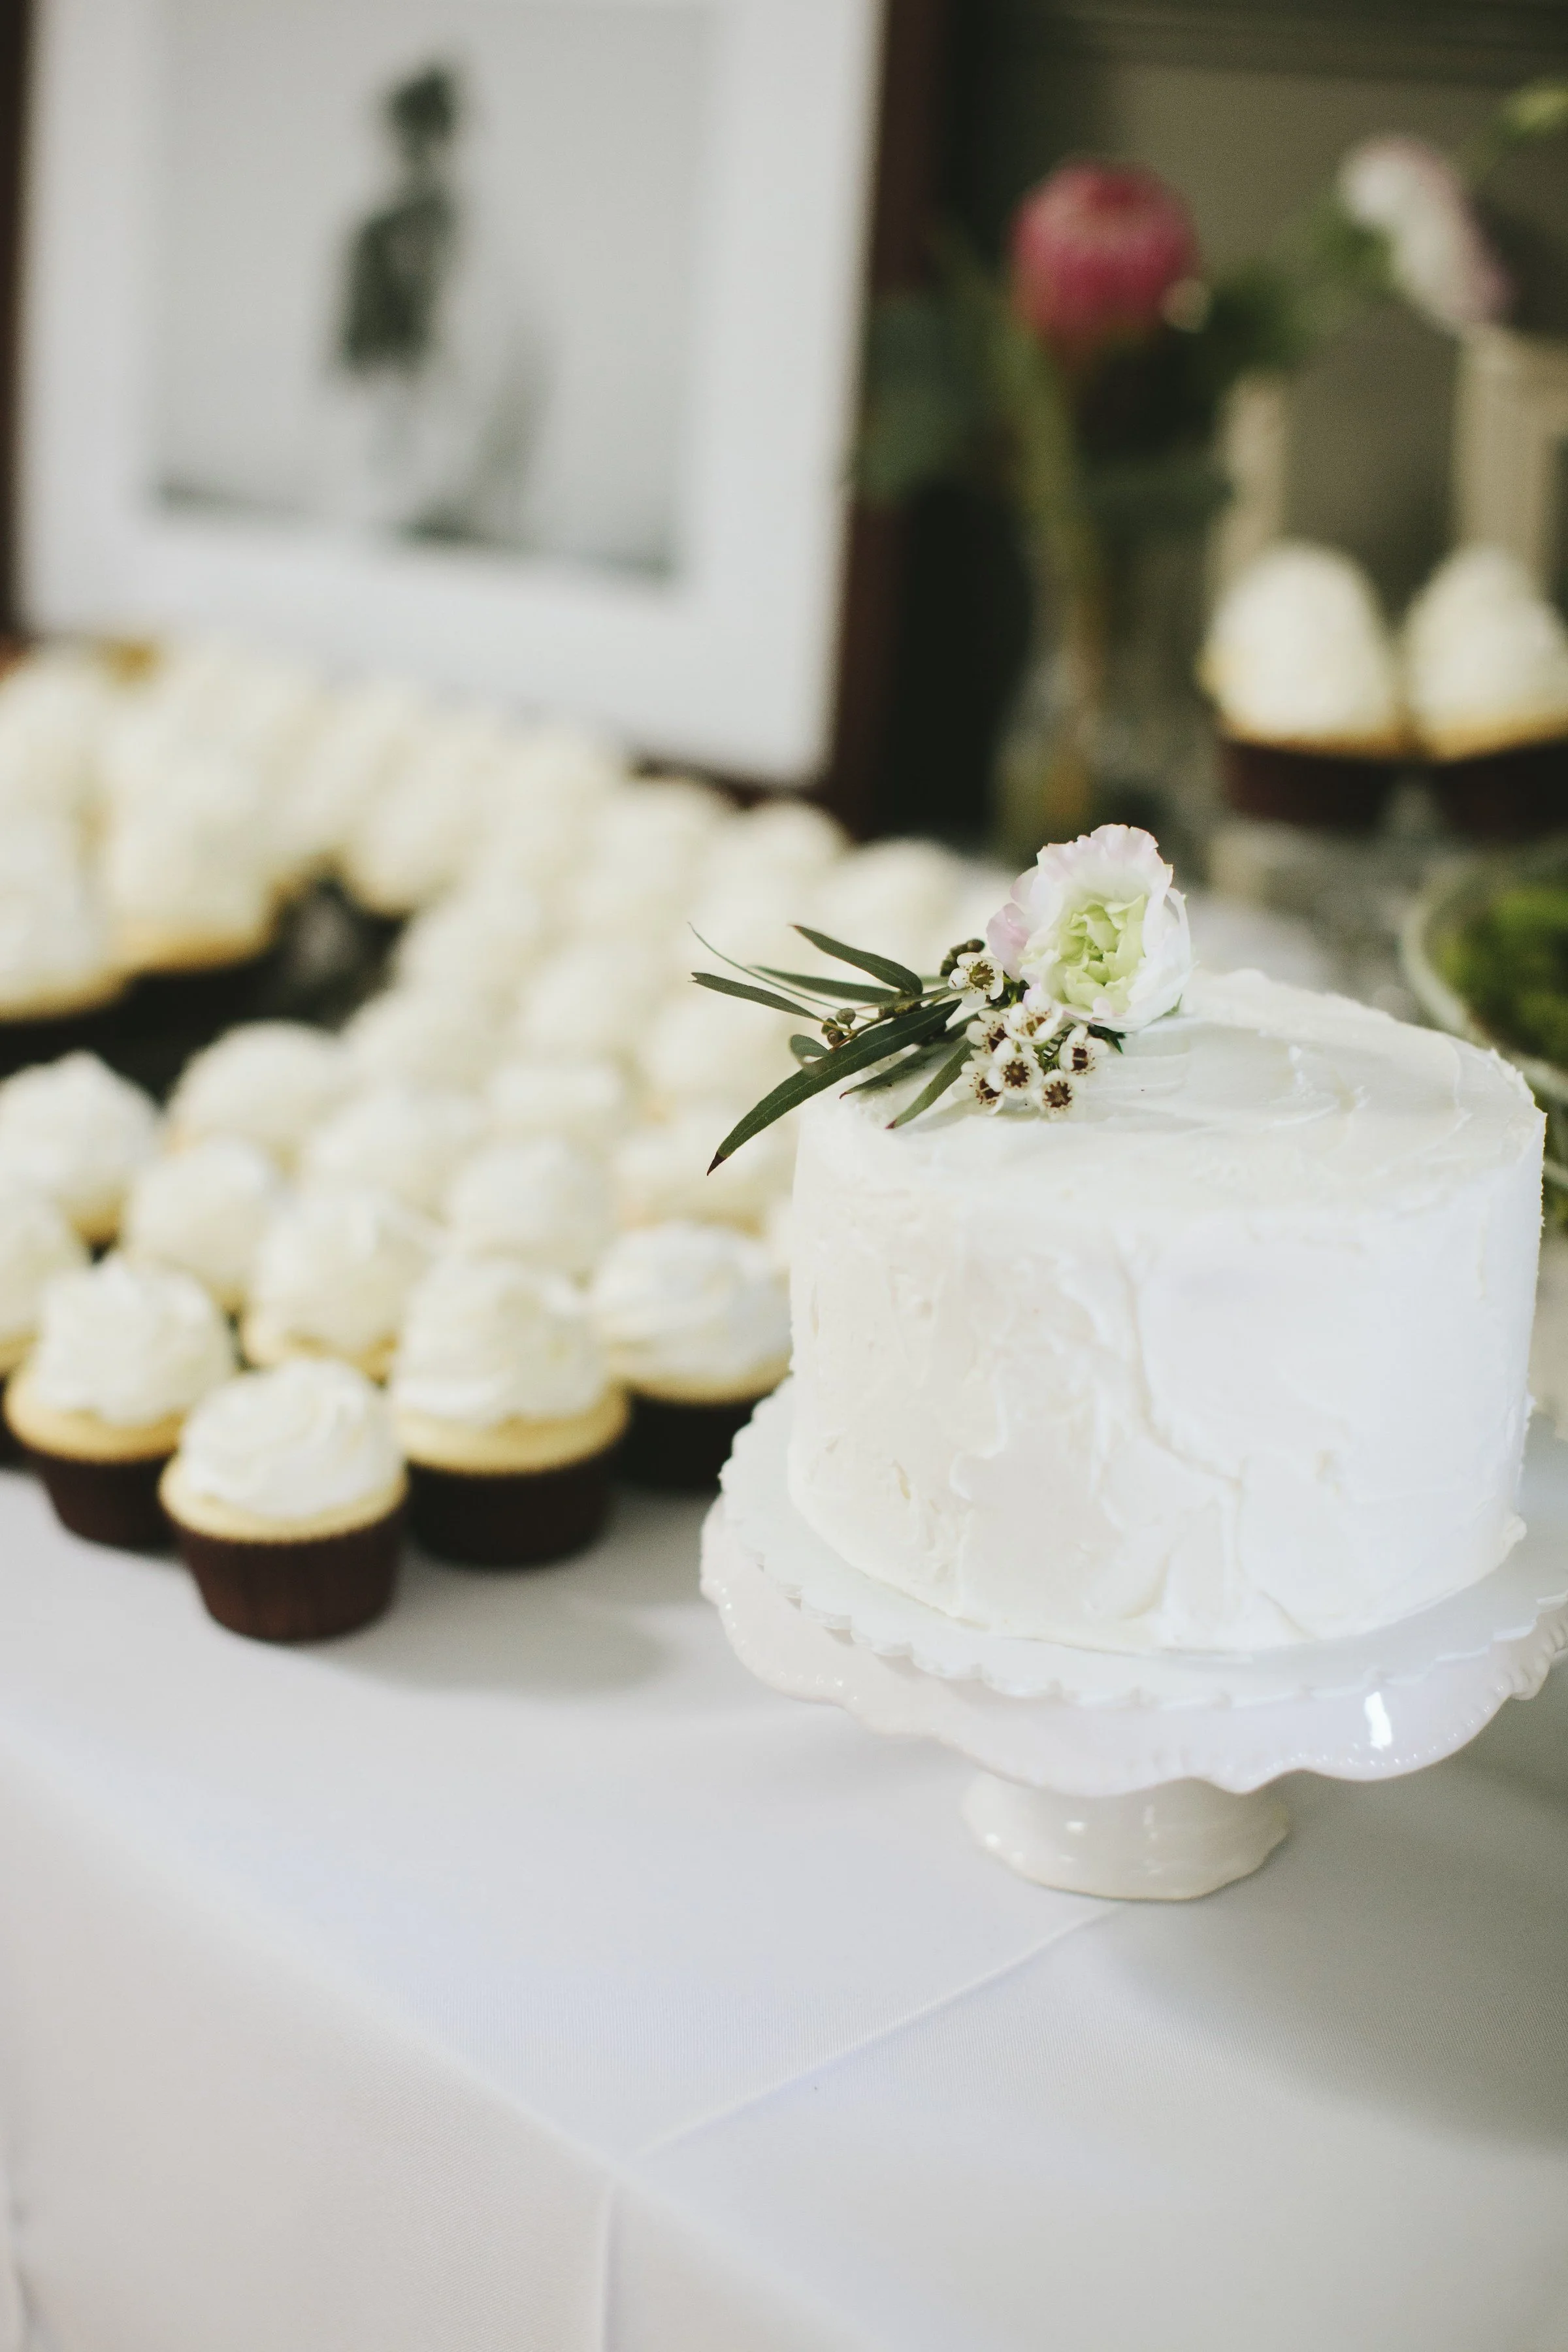
Totals: 28 round table arrangements with 2 alternating designs, 3 side table arrangements, 4 bathroom arrangements, 6 boutonnières, 5 bouquets, and 1 cake topper

Data visualization for the wedding win? I’d like to think so!
All data can be visualized. The trick is finding a balance between what the user has and what they need to make decision in their everyday life. I believe this project to be small but mighty in it’s success.
Image courtesy of MorningWild Photography